Drafter is a graphical tool for building a distributed system.
Suppose Research Team A creates an image source, while Team B has written an image analysis program. Finally, Team C will feed the results of the image analysis into a data visualization tool and display them to the user. We can bring the work of these three teams together to run one unified pipeline. Here is an example using the Paper Tablet visual processor developed at Instituo Superior Técnico Lisboa.
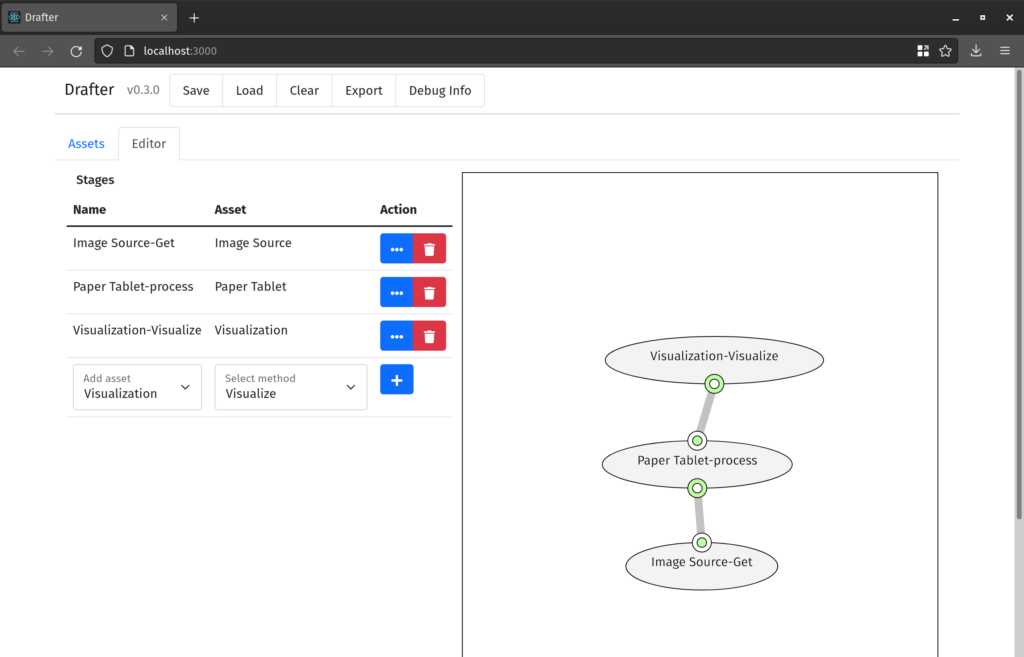
An example topology in Drafter
Assets and Interfaces
Constructing any one of these pipelines is simple. The work contributed by each group is known as an Asset. An asset could be a data source, an AI model, a graphics processor, a data visualizer or really any kind of project that either consumes or produces data.
Assets are encapsulated as Docker Images for compatibility with the AI4EU marketplace. In order for Drafter to understand what kind of data an Asset can produce or consume, a user should also provide a Protobuf file that describes the interface of the Asset.
In order to add an Asset to drafter, click the ‘Assets’ tab on the top-left of the interface. Name the asset, type in the Docker identifier, and upload your Protobuf interface. Then click the + icon and your asset will be in Drafter’s state.
Stages and Edges
Once you’ve added all your assets to Drafter, you can begin constructing your network topology. When instantiating assets into drafter, we call them stages. Think about it like a stage in a recipe, or a step in a processing pipeline. And while there need only be one asset describing and identifying a project, there can be multiple stages corresponding to one asset. This is useful if, for example, you would like to run several instances of your image processing node in parallel.
In order to create a stage, click the ‘Editor’ tab in Drafter. There will be a drop-down box asking you to add an asset. Choose an asset that you added previously. Then, choose a method of the asset to use. This will specify which function of your interface you want to expose. Click the + button and your stage will appear in the editor view.
Stages in the editor have one or two ports, or access points, around their edges. These represent function inputs and outputs. Each stage exposes one gRPC method, and can have at most one input and one output, corresponding to the input and output of this method. Inputs and outputs are also color-coded. Each type is colored differently and only inputs and outputs with a matching type may be connected. If an input or an output takes an empty type called Empty as a parameter, or returns it from the method, that input or output is considered the beginning or end of the pipeline and is not displayed. Each input has a colored outer ring and a white inner ring, while each output has a colored inner ring and white outer ring.
In order to make connections, take an input and an output, each with the same color. Then drag one to the other, and drop. This should connect the nodes.
Deploying
Now that you have made your connections, you should be ready to deploy your pipeline. Click the ‘Export’ button in the top menu bar to download a ZIP file containing your solution. Once this is downloaded, you should be able to run:
$ docker compose upto deploy the solution. This will download the Docker images for your solution, as well as the orchestrator, and begin running your code.
Miscellany: Saving, Loading, Debugging
Drafter is a relatively new invention, and as such has a few features that should help to ease frustration. Click ‘Save’ to save the editor state in a JSON file. Click ‘Load’ to load a JSON file and restore editor state. Click ‘clear’ to reset the editor, and click ‘Debug Info’ to see edit history, editor state, and other features. Please be careful while editing, because closing your window will result in your progress being lost.
In the video below we see an interaction with drafter that builds the yolo pipeline, described in AI4EU’s draft paper on hybrid pipelines https://arxiv.org/pdf/2202.12566.pdf